Note: This a very lengthy post. So, it’ll be a good idea to read it first thing in the morning when your mind is fresh and while you’re having your wake up coffee (or tea, or milk, or cold water, or nothing).
Another note: This is a very technical and a very advanced post. It is mainly aimed for developers, but non-developers can still enjoy it nonetheless, or can just scroll down to the bottom of this post for the chart.
So far, we haven’t upgraded any of our customers to Joomla 3.8.x, and this is because we learned our lesson a few years ago to wait a couple of months before updating to the latest version of Joomla (unless, of course, the update is a major security patch). However, we are very close followers of the Joomla community, and we have read and heard many comments about the bad performance of Joomla 3.8 when it is compared to Joomla 3.7. We did communicate these concerns to the Joomla developers, who discovered that some events were triggered twice in Joomla 3.8.0 (leading to a major performance issue on large Joomla sites), and who fixed that problem in 3.8.1.
So, is Joomla 3.8.1 faster or slower to Joomla 3.7.5? In this post, we decided to benchmark Joomla 3.8.1 against Joomla 3.7.5, in order to provide a definitive answer to the question.
The Setup
We used an idle dedicated server for our test. The server had the following technical specifications:
- Processor: Intel Xeon E3-1271 v3 Quad-Core
- Memory: 16 GB DDR3 SDRAM (SDRAM, in case you’re wondering, stands for Synchronous Dynamic Random Access Memory)
- Disk: 250 GB SSD Drive
The following software was installed on the server:
- Operating system: CentOs 6 – 64Bit
- Web server: Apache 2.4
- Database server: MySQL 5.5
- PHP version: PHP 5.6
Since we didn’t have any benchmarking tool on the server, we installed ab, the Apache HTTP server benchmarking tool, which is developed by the Apache Software Foundation. Here’s how we installed it
- We edited the yum.conf file which is located under the /etc folder to remove httpd from the exclusion list. We opened the file using vi:
vi /etc/yum.confFrom the exclude line (which is the second line in the file), we removed the httpd* entry, to allow the install of the ab tool through yum. We saved the file and exited vi.
- We then issued the following command in order to ensure that we can now install ab through yum:
yum provides /usr/bin/ab(Note: If you see No matches found when you issue the above command, then try contacting your host).
-
Once we were sure that we were able to install ab, we installed it using the following command:
yum install httpd-tools
Now that we have installed ab, te next step was to create 2 cPanel accounts, joomla375.com and joomla381.com (this was easily done through WHM). As you might have guessed, the first account was created in order to install a Joomla 3.7.5 website, while the latter was used for a Joomla 3.8.1 website. But, before installing Joomla on either account, we had to modify the hosts file on our PC and on the server so that these domains resolve to the test server. For our PC, we modified the hosts file which is located under the C:\Windows\System32\drivers\etc folder to include the following 2 lines:
[ip-address-of-the-server] joomla375.com www.joomla375.com

[ip-address-of-the-server] joomla381.com www.joomla381.com
For the server, we added the same lines above in the /etc/hosts file.
At this point, we were ready to install Joomla. We installed Joomla 3.7.5 on joomla375.com and Joomla 3.8.1 on joomla381.com (we will spare you the boring installation details), and – we chose to include the blog test data for both. joomla375.com and joomla381.com ended up being identical sites.
We opened the file my.cnf file under the /etc folder and we added the following 2 lines immediately after [mysqld]:
general_log = on

general_log_file=/var/lib/mysql/all-queries.log
We then restarted MySQL. In case you’re wondering, the above 2 lines will log any query that hits the database server to the all-queries.log file (located under /var/lib/mysql/ folder).
The Benchmarking
Typically, benchmarking is done by issuing a number of concurrent connections to the website for a specific amount of time using a benchmark tool such as ab, then examining the results and comparing them to a different website. However, since we are working on 2 identical websites using the same CMS with a different version, we thought that it’s a good idea to add another metric to the test, which is the size of the query file generated by a page load (or a number of pages loads). In other words, we load the homepage of each Joomla website, with the general_log on, and we compare the size (in bytes) of the all-queries file generated by each Joomla website to the one generated by the other. We will consider that smaller is better (we agree that it is not an accurate benchmark, since the complexity of a query is not always proportional to its string length).
We started with the all-queries benchmark first. Here’s how we did it:
We first loaded the homepage of the Joomla 3.7.5, and we examined, the size in bytes, of the all-queries.log file, and it was 21473 bytes. We emptied the all-queries.log file, and we did the exact same test on the Joomla 3.8.1 website. The size of the file was 18552 bytes. For us, it was a shocking surprise, because we expected the complete opposite. We didn’t expect Joomla 3.8.1 to have about 3 KB less queries than Joomla 3.7.5, so naturally, we were curious. We compared the 2 files and it turned out that Joomla 3.8.1 got rid of all the unnecessary (and never used) references to the #__content_rating table. We did mention the unnecessary references to the #__content_rating table before, and it seems that someone from the Joomla core team was listening then. Other than the removal of the #__content_rating table, we didn’t really find much difference between the 2 files. They were almost identical.
Our next test scenario was slightly more elaborate, as it consisted of doing the following (in the exact sequence below) on the 2 sites:
- Logging in to the Joomla website.
-
Adding a user with default privileges.
-
Adding an article to the Blog category.
-
Viewing the homepage.
In this test, the results were more in line with our expectations: the size of the all-queries.log file was 161394 bytes for Joomla 3.7.5 and 209505 bytes for Joomla 3.8.1, which amounted to almost exactly a 30% increase in the size of the query file in Joomla 3.8.1. Again, we were curious as to what was different, and so we compared the 2 files. This time, we discovered something very interesting…
The all-queries.log file of the Joomla 3.8.1 website was littered with the following query:
SELECT COUNT(`extension_id`) FROM `#__extensions` WHERE `element` = '[com_extension]' AND `type` = 'component'
com_extension was the name of a component, such as com_content, com_menu, etc…. There were hundreds of these weird queries (375 to be exact) – many were repeated! For example, the following query…
SELECT COUNT(`extension_id`) FROM `#__extensions` WHERE `element` = 'com_menu' AND `type` = 'component'
…was literally 45 times in the log file.
These 375 queries didn’t exist in Joomla 3.7.5 (375 queries didn’t exist on Joomla 3.7.5, is it really just a coincidence, or were the developers trying to tell us something?), and these 375 queries resulted in the 30% increase in the size of the log file.
Now, this query logging method is not scientific, and we didn’t really expect to learn much from it, but we did. We did learn that there is a huge overhead (about 50 additional queries per page) in Joomla 3.8.1, and it’s all because of these weird queries…
The next step was to use the classical method for benchmarking, which is the ab method. So, we issued the following 2 commands in the Linux shell:
ab -c 10 -t 10 "http://www.joomla375.com/"
which returned the following:
This is ApacheBench, Version 2.3 <$Revision: 655654 $>
Copyright 1996 Adam Twiss, Zeus Technology Ltd, http://www.zeustech.net/
Licensed to The Apache Software Foundation, http://www.apache.org/

Benchmarking www.joomla375.com (be patient)
Finished 737 requests


Server Software:        Apache/2.4.23
Server Hostname:        www.joomla375.com
Server Port:            80

Document Path:          /
Document Length:        18052 bytes

Concurrency Level:      10
Time taken for tests:   10.000 seconds
Complete requests:      737
Failed requests:        0
Write errors:           0
Total transferred:      13676509 bytes
HTML transferred:       13304324 bytes
Requests per second:    73.70 [#/sec] (mean)
Time per request:       135.688 [ms] (mean)
Time per request:       13.569 [ms] (mean, across all concurrent requests)
Transfer rate:          1335.57 [Kbytes/sec] received

Connection Times (ms)
              min  mean[+/-sd] median   max
Connect:        0    0   0.0      0       0
Processing:    56  133 139.6    115    1482
Waiting:       56  132 139.6    115    1482
Total:         56  133 139.6    115    1482

Percentage of the requests served within a certain time (ms)
  50%    115
  66%    124
  75%    131
  80%    135
  90%    146
  95%    162
  98%    183
  99%   1306
 100%   1482 (longest request)
…and…
ab -c 10 -t 10 "http://www.joomla381.com/"
…which returned the following:
This is ApacheBench, Version 2.3 <$Revision: 655654 $>
Copyright 1996 Adam Twiss, Zeus Technology Ltd, http://www.zeustech.net/
Licensed to The Apache Software Foundation, http://www.apache.org/

Benchmarking www.joomla381.com (be patient)
Completed 5000 requests
Completed 10000 requests
Completed 15000 requests
Completed 20000 requests
Completed 25000 requests
Completed 30000 requests
Completed 35000 requests
Completed 40000 requests
Completed 45000 requests
Completed 50000 requests
Finished 50000 requests


Server Software:        Apache/2.4.23
Server Hostname:        www.joomla381.com
Server Port:            80

Document Path:          /
Document Length:        328 bytes

Concurrency Level:      10
Time taken for tests:   2.643 seconds
Complete requests:      50000
Failed requests:        0
Write errors:           0
Non-2xx responses:      50000
Total transferred:      28000000 bytes
HTML transferred:       16400000 bytes
Requests per second:    18918.25 [#/sec] (mean)
Time per request:       0.529 [ms] (mean)
Time per request:       0.053 [ms] (mean, across all concurrent requests)
Transfer rate:          10345.92 [Kbytes/sec] received

Connection Times (ms)
              min  mean[+/-sd] median   max
Connect:        0    0   0.1      0       1
Processing:     0    0   0.1      0       1
Waiting:        0    0   0.1      0       1
Total:          0    1   0.1      0       1
ERROR: The median and mean for the total time are more than twice the standard
       deviation apart. These results are NOT reliable.

Percentage of the requests served within a certain time (ms)
  50%      0
  66%      1
  75%      1
  80%      1
  90%      1
  95%      1
  98%      1
  99%      1
 100%      1 (longest request)
The first command was used to benchmark the Joomla 3.7.5 website, and the second command was used to benchmark the Joomla 3.8.1. So, which one did better?
Before examining the results of the ab command (which are very interesting), let us dissect and explain the ab command line that we issued:
ab -c 10 -t 10 "http://www.joomla381.com/"
The above means that we are sending 10 concurrent (or simultaneous) connections (-c 10) for a maximum of 10 seconds (-t 10) on the website http://www.joomla381.com/ (Note: adding -k to the above command will force the use of the HTTP KeepAlive feature).
Going back to the results, at first glance, it is very obvious that Joomla 3.8.1 did much, much better than Joomla 3.7.5. In fact, Joomla 3.8.1 was able to process 50,000 requests in 2.643 seconds, while Joomla 3.7.5 only processed 737 requests in 10 seconds. The time per request for Joomla 3.8.1 was a a very impressive 0.529 milliseconds, while that of Joomla 3.7.5 was a very slow 135.688 milliseconds. So, if we were to end this article now and we were to use this benchmark data, then we can conclude that Joomla 3.8.1 is 257 times faster than Joomla 3.7.5. This is just too good to be true – more like unbelievable (and rightly so, as you will learn later in this post). So we closely examined the above numbers and we noticed that there was some kind of cheating going on. You see, while the Joomla 3.7.5 website responded with 18052 bytes (this is the Document Length), Joomla 3.8.1 responded with a mere 328 bytes. Clearly, the Joomla 3.8.1 website wasn’t giving the full response.
As you might have guessed, we investigated further…
So, we grabbed the Joomla 3.8.1 website using wget with the following command…
wget http://www.joomla381.com/
…and we got the following response:
Resolving www.joomla381.com... [ip-address]

Connecting to www.joomla381.com|[ip-address]|:80... connected.

HTTP request sent, awaiting response... 403 Forbidden
Aha – the website was returning a 403 error, and then it hit us, we denied, in the .htaccess file of the Joomla 3.8.1 website, all IPs from accessing it with the exception of our IP; so we needed to add the IP of the server as well. The Joomla 3.7.5 website didn’t have the problem because the server IP was already authorized in an allow statement in the .htaccess file.
So, it wasn’t really a conspiracy or cheating or foul play or anything (it’s always easy to blame the poor Joomla development team for anything), it was just us being tired. So we decided to continue our experimentation the next morning.
The next morning (well, at 3 AM to be exact), we continued our work. The first thing that we did was to add the server IP to the .htaccess file of the Joomla 3.8.1 website, and then we re-executed the following ab statement in the shell:
ab -c 10 -t 10 "http://www.joomla381.com/"
This time, it returned totally different results:
This is ApacheBench, Version 2.3 <$Revision: 655654 $>
Copyright 1996 Adam Twiss, Zeus Technology Ltd, http://www.zeustech.net/
Licensed to The Apache Software Foundation, http://www.apache.org/

Benchmarking www.joomla381.com (be patient)
Finished 714 requests


Server Software:        Apache/2.4.23
Server Hostname:        www.joomla381.com
Server Port:            80

Document Path:          /
Document Length:        18691 bytes

Concurrency Level:      10
Time taken for tests:   10.038 seconds
Complete requests:      714
Failed requests:        0
Write errors:           0
Total transferred:      13705944 bytes
HTML transferred:       13345374 bytes
Requests per second:    71.13 [#/sec] (mean)
Time per request:       140.583 [ms] (mean)
Time per request:       14.058 [ms] (mean, across all concurrent requests)
Transfer rate:          1333.45 [Kbytes/sec] received

Connection Times (ms)
              min  mean[+/-sd] median   max
Connect:        0    0   0.0      0       0
Processing:    58  137 146.1    117    1530
Waiting:       58  137 146.1    117    1530
Total:         58  137 146.1    118    1530

Percentage of the requests served within a certain time (ms)
  50%    118
  66%    127
  75%    134
  80%    138
  90%    153
  95%    168
  98%    187
  99%   1332
 100%   1530 (longest request)
Now it’s more like it. The document length was 18691 bytes, which is very close to the 18052 bytes returned by the Joomla 3.7.5 website (by the way, it would be interesting to know why there is a 639 bytes difference between the 2 – but it’s really outside the scope of this post). The number of completed requests is 714 requests, with a mean time of 140.583 milliseconds. The Joomla 3.7.5 website, in case you don’t feel like scrolling up a bit, handled 737 requests with a mean time of 135.688 milliseconds.
The Chart
At this point, the whole thing became very interesting. We had meaningful and close results. So, we decided to play with the number of connections: we issued a series of ab commands on each website with increasingly higher number of connections (e.g. we changed -c 10 to -c 20, -c 30, etc… – note that we waited a few minutes after each command for the load to return back to 0), and we got this beautiful chart (probably what you have been waiting for since the beginning of this post):
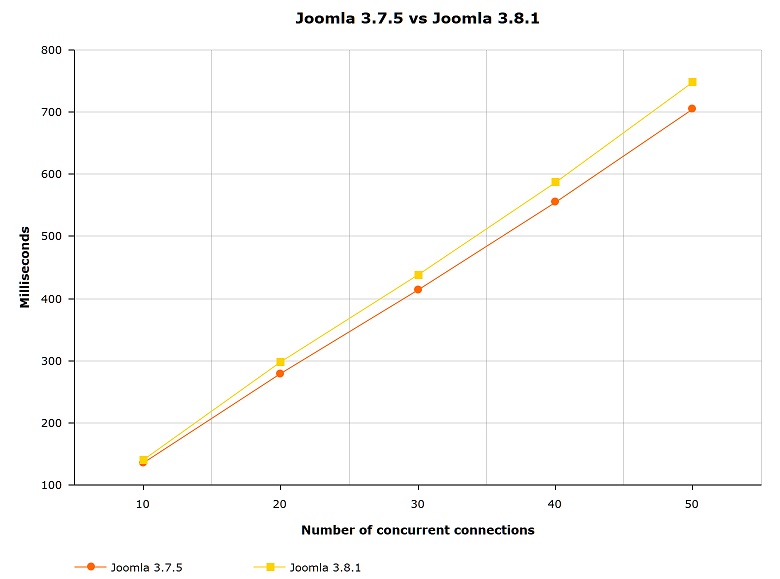
You can see in the above chart 2 things: 1) Joomla 3.7.5 consistently performs better than Joomla 3.8.1, but only slightly, and 2) the 2 lines diverge more with the number of connections. In fact, Joomla 3.8.1 is 3% slower than Joomla 3.7.5 with 10 concurrent connections, but with 50 concurrent connections, it is 6% slower.
So, there you have it. Joomla 3.8.1 is slower than Joomla 3.7.5, and we’re totally not lying with stats charts (please trust us!). In fact, you can conduct the same test yourself and you will likely get similar results.
We hope that you found this post informative and that you had fun reading it. If you have any questions about it, or if you need help optimizing your Joomla 3.8.1 website, then all you need to do is to contact us. Our fees are affordable (and haven’t increased for the past 7 years), our work is clean, and we are the friendliest Joomla developers in the Milky Way (unless, of course, Mars turns out to be populated by extremely friendly Joomla developers).